SLOfit – more than just measurements and fitness tests!
The results of the measurements can tell you a lot if you know how to explain them correctly. Here you will find out how to understand the printout of the results of SLOfit measurements, and how to explain individual results of measurement tasks.
The SLOfit application enables a range of other analyses, e.g. creation of a report on physical performance, the possibility of granting access to your My SLOfit data to others (e.g. kinesiologist, doctor), additional measurements and reports (e.g. 24-hour movement behaviours). If, as a user, you have saved results from the school period in your application, you will be able to compare the measurement tasks together, building a trend of results from childhood to adulthood.
Evaluation of the results using centile values
For each measurement task in SLOfit, we calculate the centile value of the raw fitness test score. This tells us where the individual score ranks on a scale of 1 to 100, specific for each gender and age. The centile values are also calculated for the entire population, again separated by age and gender. Additionally, for each raw score, the proportion (%) of the score that is lower or higher than a given raw score is examined. So, a centile value of 50 means that the test result of a given measurement task corresponds to the national average.
For all measurement tasks, a lower value represents a lower centile and a higher value represents a higher centile. If the centile value is higher (e.g. 60), this means that the result is better than 60% of the results of participants of the same age and gender.. Data in the report are presented using raw and centile values, separated by age and gender. In this way, the centile values of different measurement tasks can be directly compared. Based on all measurement results, we can calculated the physical fitness (PFI). At the end of the school year, teachers receive an individual report for each student with the raw test results and the centile values for each test. Moreover, the reports also include the raw and centile scores for physical fitness for the entire class, separated by gender individual reports for each student. Thanks to the centile values and the ITF, we can compare the results of the whole class with the results of other Slovenian classes, schools and regions.
A centile value of 50 means that the result of a certain measurement task corresponds to the national average. If the centile value is higher (e.g. 60), it means that the result is better than 60% of the results of participants of the same age and gender.
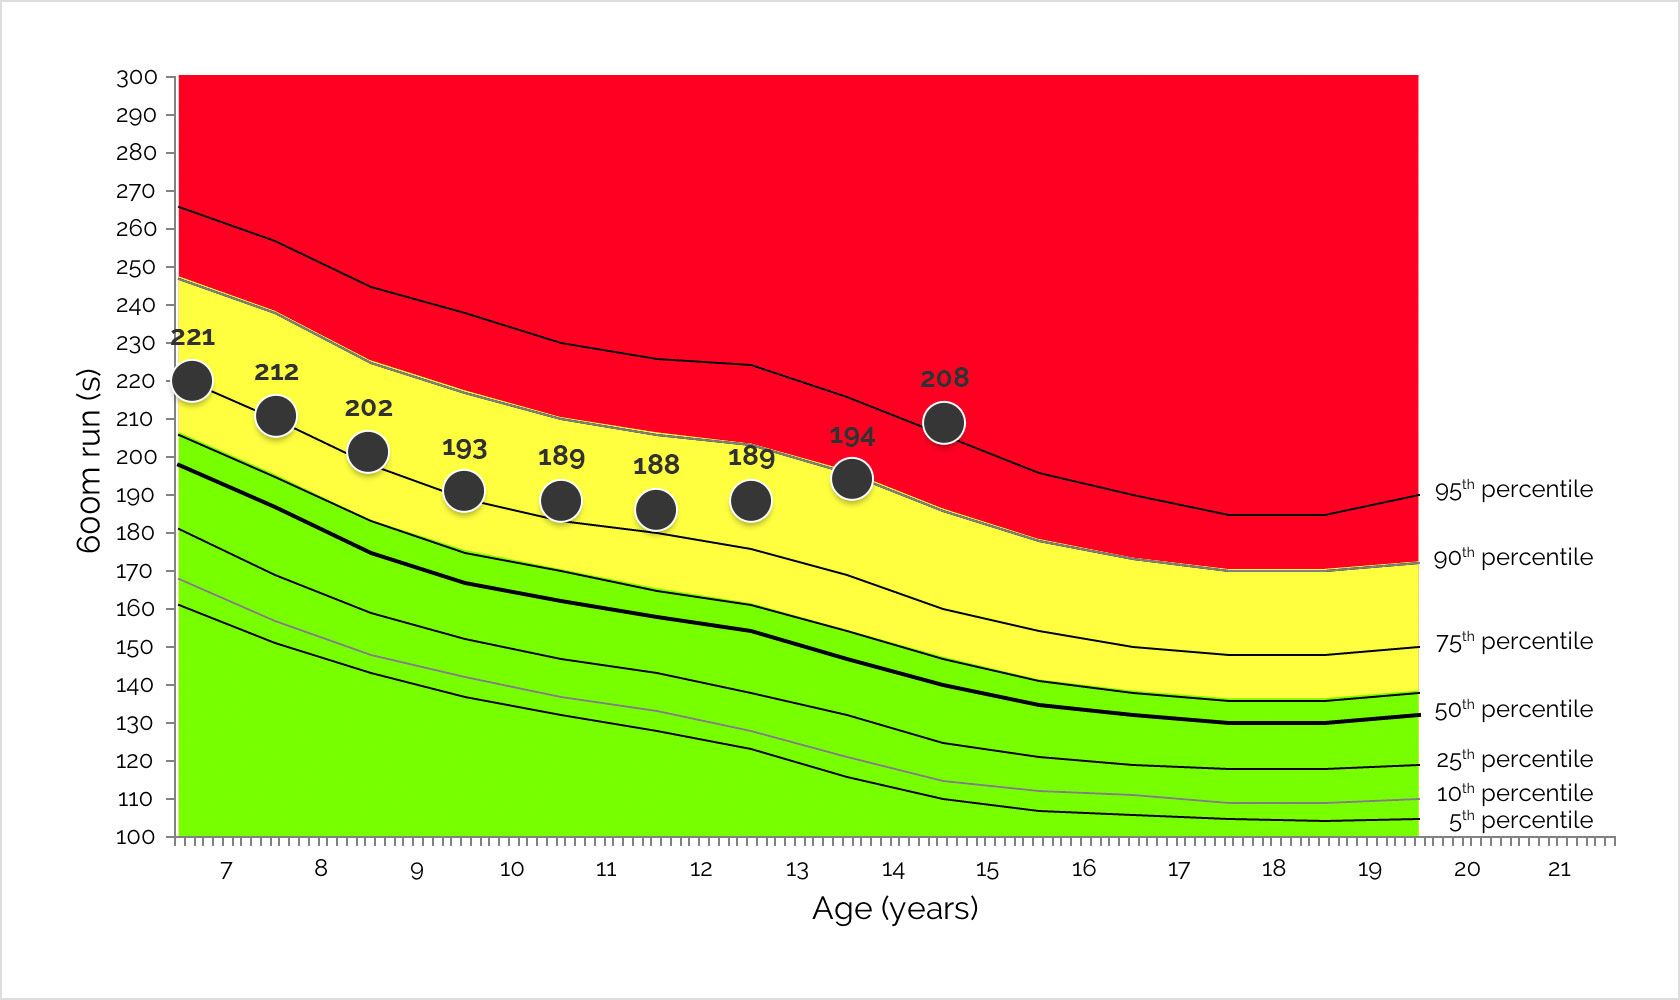
For individual measurement tasks, we determine health risk areas for the individual results.
Height and weight have no distinct risk areas. Body mass index and waist circumference results are classified into 4 different ranges:
- (a) Yellow color: LOWER,
- (b) Green color: NORMAL,
- (c) Orange color: CAUTION,
- (d) Red color: HIGHER RISK.
We also classify all movement measurement tasks into 3 areas:
- (a) Green color: HEALTHY,
- (b) Yellow color: IMPROVEMENT NEEDED,
- (c) Red color: RISKY - IMPROVEMENT NEEDED.
If the measurements are performed regularly every year, the participant can observe the development, maintenance or decrease of his physical performance.

Evaluation of results
Data in the report are presented using scores, centile values (according to age and gender) and health benefit points . Scores allow us to observe changes in measurement units, e.g. number of repetitions, second. However, this information is limited since children generally improve in fitness through the childhood because of growing. Therefore, we are calculating their scores in centiles for each gender and age. This gives us information about where the individual score ranks on a scale from 1 to 100. A centile value of 50 means that the result of a certain measurement task is equal to the national average. If the centile value is higher (e.g. 60) this means that the result is higher than 60% of the results of participants of the same age and sex. Furthermore, we are presenting their scores in health benefit points. Namely, in some measurements, like BMI or time measurement (e.g. running, where lower score is better) it is not beneficial for health if your score is on 90th centile. In BMI and triceps skinfold, it is also health risky if your score is on 5th centile. Based on this, we determine health risk areas for the individual scores: Body height and weight do not have marked risk zones.
All other scores are classified into 3 different areas:
- Green colour: HEALTHY,
- Yellow colour: IMPROVEMENT NEEDED,
- Red colour: RISKY - IMPROVEMENT NEEDED.
If measurements are taken regularly every year, the participant will be able to observe their trends in terms of development, maintenance or decline in their physical performance. In SLOfit Students programme, we calculate also the physical fitness index (PFI) which provide teacher instant picture on fitness level of student. Moreover, besides individual reports, teachers get class report and principals get school report. Within these reports there are also comparison of class and school results with other classes/schools within municipality, region and country.